colour_visuals.VisualSpectralLocus2D#
- class colour_visuals.VisualSpectralLocus2D(cmfs: MultiSpectralDistributions | str | Sequence[MultiSpectralDistributions | str] = 'CIE 1931 2 Degree Standard Observer', method: Literal['CIE 1931', 'CIE 1960 UCS', 'CIE 1976 UCS'] | str = 'CIE 1931', labels: Sequence | None = None, colours: ArrayLike | None = None, opacity: float = 1, thickness: float = 1)[source]#
Bases:
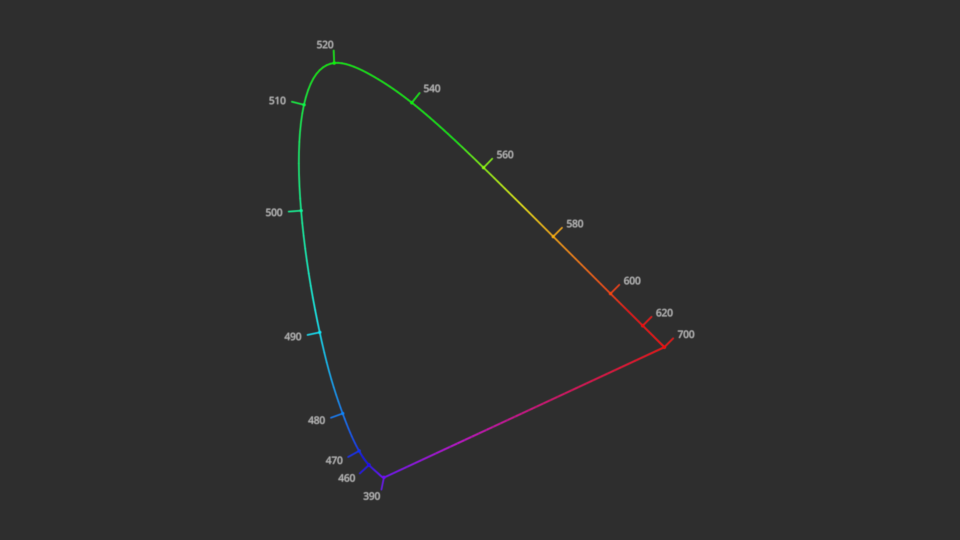
GroupCreate a 2D Spectral Locus visual.
- Parameters:
cmfs (MultiSpectralDistributions | str | Sequence[MultiSpectralDistributions | str]) – Standard observer colour matching functions used for computing the spectrum domain and colours.
cmfscan be of any type or form supported by thecolour.plotting.common.filter_cmfs()definition.method (Literal['CIE 1931', 'CIE 1960 UCS', 'CIE 1976 UCS'] | str) – Chromaticity Diagram method.
labels (Sequence | None) – Array of wavelength labels used to customise which labels will be drawn around the spectral locus. Passing an empty array will result in no wavelength labels being drawn.
colours (ArrayLike | None) – Colours of the visual, if None, the colours are computed from the visual geometry.
opacity (float) – Opacity of the visual.
thickness (float) – Thickness of the visual lines.
Examples
>>> import os
>>> from colour.utilities import suppress_stdout
>>> from wgpu.gui.auto import WgpuCanvas
>>> with suppress_stdout():
...     canvas = WgpuCanvas(size=(960, 540))
...     scene = gfx.Scene()
...     scene.add(
...         gfx.Background(
...             None, gfx.BackgroundMaterial(np.array([0.18, 0.18, 0.18]))
...         )
...     )
...     visual = VisualSpectralLocus2D()
...     camera = gfx.PerspectiveCamera(50, 16 / 9)
...     camera.show_object(visual, up=np.array([0, 0, 1]), scale=1.25)
...     scene.add(visual)
...     if os.environ.get("CI") is None:
...         gfx.show(scene, camera=camera, canvas=canvas)
...
- __init__(cmfs: MultiSpectralDistributions | str | Sequence[MultiSpectralDistributions | str] = 'CIE 1931 2 Degree Standard Observer', method: Literal['CIE 1931', 'CIE 1960 UCS', 'CIE 1976 UCS'] | str = 'CIE 1931', labels: Sequence | None = None, colours: ArrayLike | None = None, opacity: float = 1, thickness: float = 1)[source]#